(Alternate Title: A Toolkit for Making Political Opponents Look Bad Using Stock Market Data)
This tweet came across my Twitter feed a couple days ago.
if you like to keep score, here's the change in Dow Jones Industrial Average from Inauguration Day to Aug 12 of their 3rd year in the White House: GHWB: +34.2% Clinton: +42.4% GWB: -11.9% Obama: +41.7% Trump: +30.1%
The first thing I thought was this was an interesting fact and somewhat counter intuitive — we know how much Trump likes to crow about the stock market when it’s doing well. Quickly my skepticism kicked in and I thought: why did he choose inauguration day and not election day? And also why August 12th and not some other random day? This screamed to me “well chosen example” like a lot of stock market snake oil.
Being a market and data nerd I guessed there was a very good chance you could choose a date like August 12th to make any of these 5 presidents look good compared to the others. I took a look at the data.
It turns out you can use a wide variety of dates to make any one of them look awesome compared to the others (except for one).
Election Day versus Inauguration Day
There’s a lot of time after the election prior to the inauguration of a U.S. President, on average it’s 75.2 days. A lot can happen in that time! Depending on which President you want to look good then you should carefully choose either Election Day or Inauguration Day as this makes a huge difference in the “performance.” A big part of this is that during the time between Obama’s election and inauguration the Dow dropped 17% and during the same time for Trump it rose 8.5%.
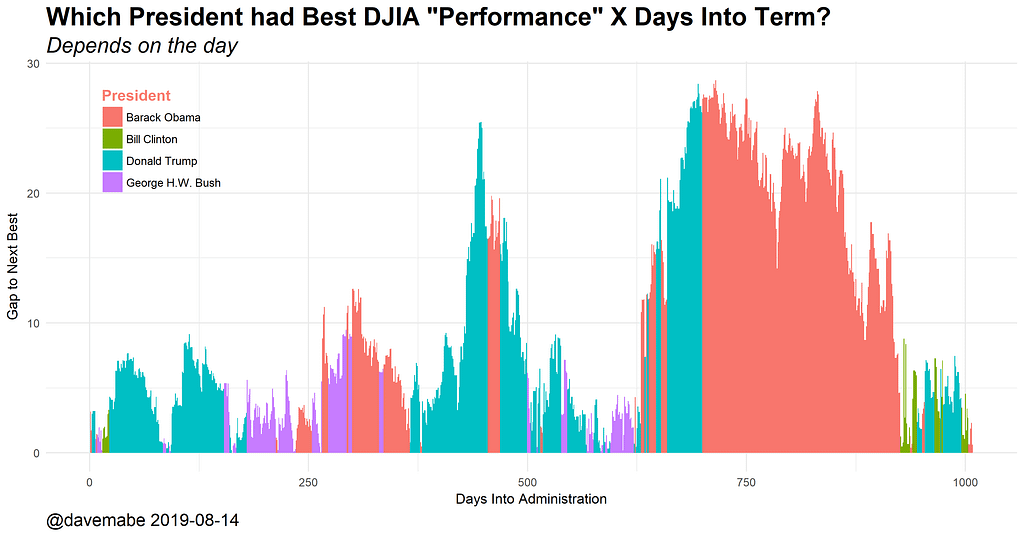
I looked at every day for the Dow Jones Industrial Average during these five presidencies. There have been 1009 days since Trump’s election, so I looked at every value 1 though 1009 to see which president’s “score” looked best by comparing the gap between each president and the second best at that point during each presidency. I used either election day or inauguration day as a reference point depending on which one produced the biggest gap between the leader and second place in percentage terms.
The Results
There’s a lot of different ways to look at these results and you’ll want to choose carefully depending on your political bias.
The most days with the largest return among these U.S. Presidents:
Trump: 425 days
Obama: 371 days
George H. W. Bush: 171 days
Bill Clinton: 41 days
George W. Bush: 0 days
That settles it, right?!?! Not really. The average gap between the leader and second place on any given day varies a lot. Looking that that:
Obama: 15.6% difference
Trump: 8.1% difference
George H. W. Bush: 3.4% difference
Bill Clinton: 3.3% difference
George W. Bush: N/A
So as you can see, it’s easy to paint a picture that makes your favorite political party/candidate look good. Eyeballing the chart I think you could even make George W. Bush’s term look good by picking his second term or a particular year as a starting point.
Why August 12th?
So why did the John Harwood choose August 12 for the tweet above? It turns out Clinton had just taken a narrow lead over Trump and then Barack Obama had just taken an even more narrow lead over Clinton. See the area on the right hand side of this chart. Excellent timing indeed!
Logical Conclusion
OK, what’s the logical takeaway from the above chart? My conclusion confirms my prior assumption: you cannot create a trading system that uses the party of the current U.S. President as any sort of meaningful input. In other words, there’s not very much correlation between market performance and political party, as much as either party wishes it were so.
If you think there is (and I often hear many claiming there is!) then your conclusion should be obvious: buy the market when your candidate wins and short the market when the other party’s candidate wins. Should be easy money!
My advice: ignore the news — especially political news and commentary. As Bryan Caplan likes to say: “News is the lie that something important happens every day.”
![]()