(I support greenways where they make sense. In fact, I’m on the Greenways Commission for the Town of Carrboro.)
You don’t have to look hard to find outlandish claims made in support of various causes these days. For example, see Trump’s “Trade wars are good and easy to win” claim. Occasionally though I come across something so egregious that I just can’t let it pass without commenting.
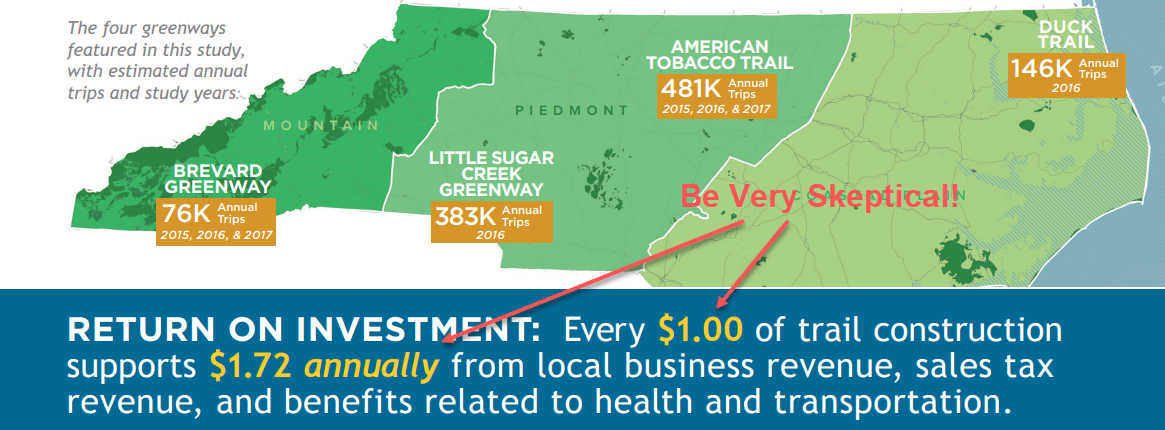
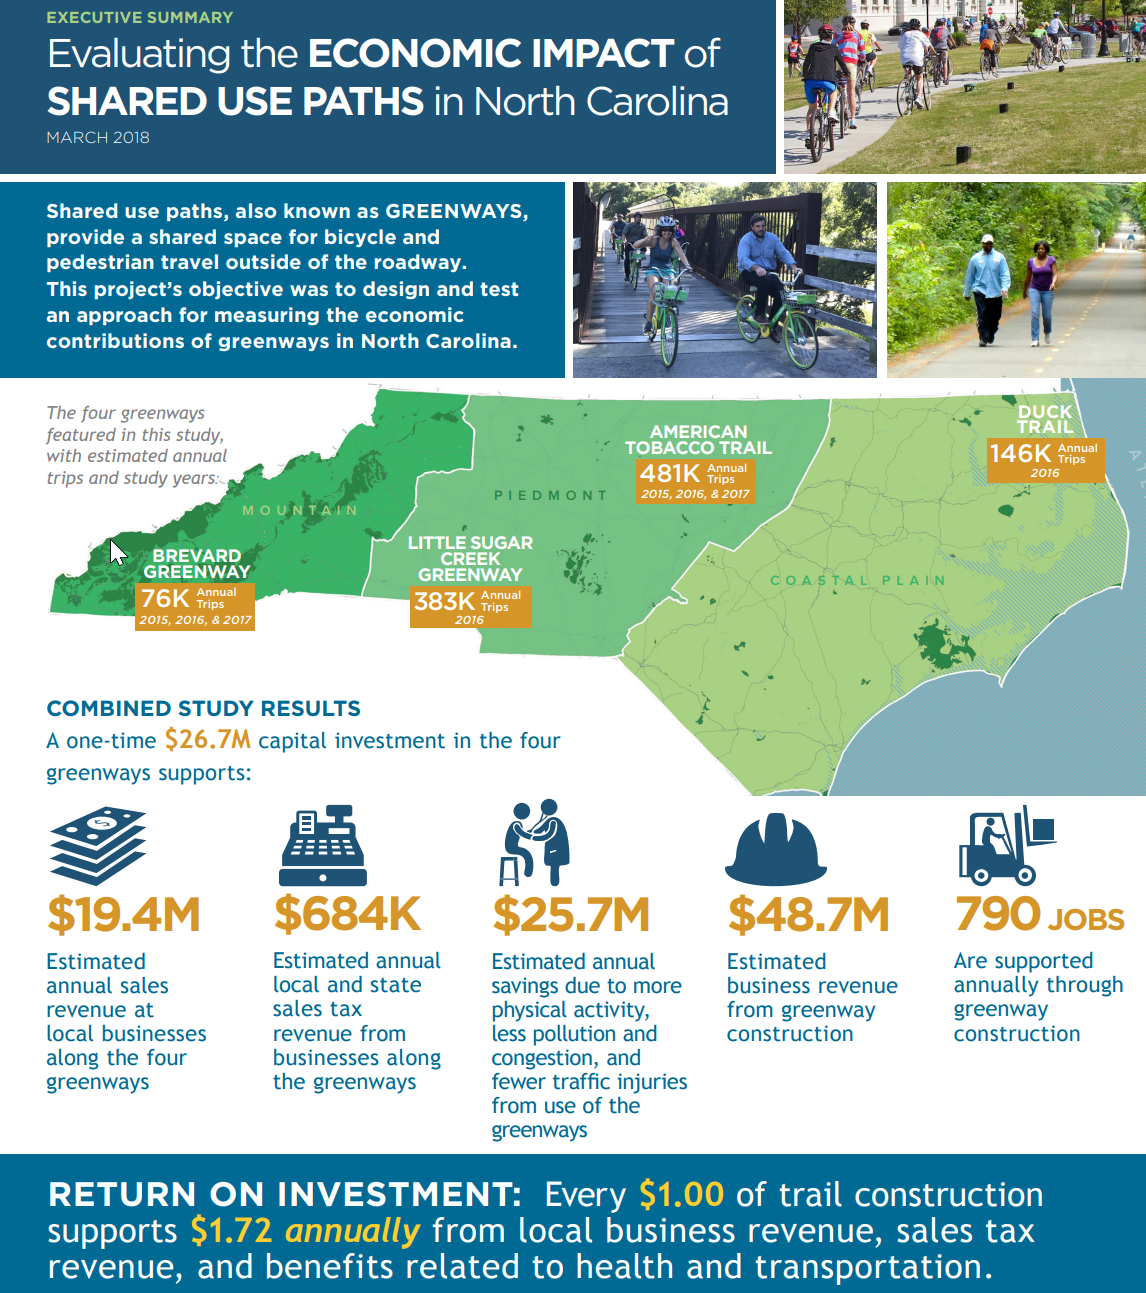
The NC DOT funded a three year study to quantify the economic benefits of shared use paths (SUPs a.k.a. greenways). Their conclusion? For every $1 spent in trail construction (once), $1.72 is generated ANNUALLY. That’s a pretty amazing statistic. Let that sink in for a minute. Is that really possible? If someone claims they can easily make a 72% return on your money every single year, do you respond with healthy skepticism? You should! This is being reported as a return on investment.
Which SUPs Should We Look At?
Let’s take a look at the study and see how they arrive at these numbers. Of course you can’t do a detailed study of every SUP in North Carolina, so you have to choose a sample that’s representative of all SUPs in NC. So how did they decide which SUPs to study?
The shared use paths studied were selected
because they:
• Have a state or regional significance.
• Have good opportunities to capture
economic revenue.
• Were not impacted by construction,
significant maintenance, or detouring
during the project period.
• Are relatively ‘established’ (i.e. at least
5 years old with minimal adjacent
land use changes anticipated).
• Have the ability to demonstrate a
transportation function.
• Are geographically dispersed across
North Carolina.
• Are a good mix between urban and
rural areas.
In other words, they picked ones that they could use to show maximum impact. You literally could not pick 4 SUPs that would show a better economic result. Not a choice I would have made but I get it. Just one page into the study and you can see where this is heading.
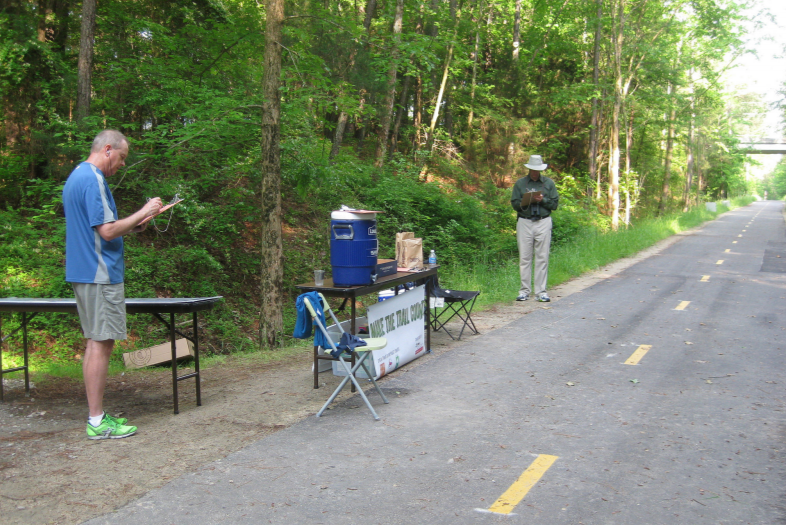
Gathering Data
They got several people together and went to each SUP and set up a survey station. This required 187 people across 3 years. They visited some SUPs just once and others every year. So it’s easy to imagine the situation – you’re running or biking along the SUP and you come across some friendly people asking you if you want to fill out a survey. Of course you can’t force people to take a survey so some choose to do it, some do not. Having spent a lot of time exercising on paths and greenways, I can imagine the type of person that on average would take a survey and, on average, would choose not to take a survey. The people that choose not to take the survey are on average more likely to be working out and not willing to stop. Of course these trips don’t generate any income at all. Excluding these SUP users are good for the final numbers! Pretty convenient!
Questions on the Survey
The survey actually looks pretty good. They ask some good questions and it’s pretty thorough. Race, gender, salary, how many people in the group for this trip, how long is your trip, transportation type – all reasonable questions. They also ask how much money they’re going to be spending on this trip and how many trips they typically take. They use this to produce tables like this one – which breaks down expenditures by type and transportation method:
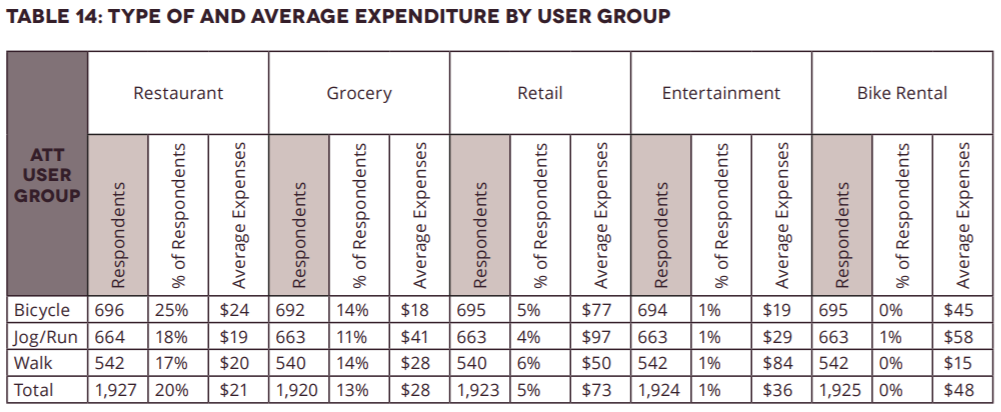
This seems fine, but as I look closely at I notice that runners sure are buying a lot of groceries! 11% of the 663 users that were running are spending $41 per trip on groceries. 18% are running to and from a restaurant to eat. 4% are on their way to buy some consumer products at $97 per trip at retail. All in all, 35% of all SUP users who are running are doing so to go spend some money. That seems extraordinarily high!
A Useful Result: SUP Users are Rich and White
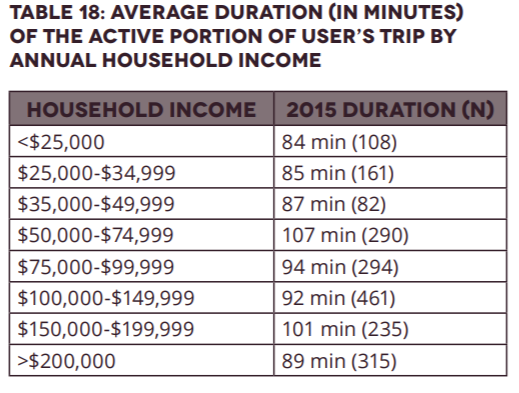
I did learn one interesting thing from the survey results. SUP users skew overwhelmingly rich and white. The second largest income bracket for users is >$200K. About 75% of SUP users earn above the US median household income of $59K. This is not something I’d thought much about before but it makes sense. I would have like to have seen an income/race breakdown by transportation type.
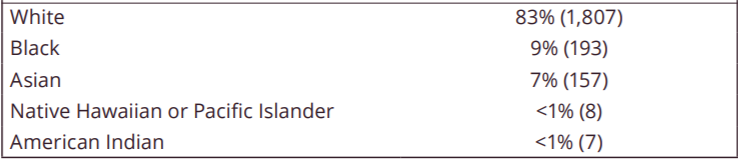
Users are overwhelmingly white at 83%. This number might not sound too skewed until you consider the fact that this SUP is in Durham where 37% of the population are people of color. I never realized that SUPs were this much of an amenity for the rich. But, hey, this is also convenient for the purposes of the desired outcome of the study!
Other Economic Impact Results Touted
The infographic at the top of the post touts not only the amazing “spend $1 now and get $1.72 annually forever” statistic. There are other stats that are asserted.
“A one time $26.7M capital investment in the four greenways” – ok first of all this number has to be way lower than the actual cost of the greenways. I expect the land alone probably costs that much. There’s obviously something I’m not understanding about that number. The implication is that $26.7M is the total cost of the SUPs and I just can’t believe it’s that low given how many bridges are on the ATT and how expensive bridges typically are. For example, in Carrboro they spent $1.3M on a quarter mile of greenway with a bridge in it.
“$48.7M in estimated business revenue from greenway construction” – a one time $26.7M investment produces $48.7M in business revenue from greenway construction? Does that make any sense?
“790 jobs are supported annually through greenway construction” – this is truly an amazing statistic that seems so absurd that it doesn’t deserve a response.
If These Stats Are Correct, What Does that Mean?
If you really can spend $1 and get a $1.72 annually, then it would make perfect sense to cancel all of North Carolina’s public projects and simply build SUPs everywhere. Sure there would be decreasing returns the more we built but there’s a tremendous amount of room to play with. Even a 4% annual return would be excellent!
The fallacy of the study is that it implies that the greenway creates the economic activity. It does no such thing. One category of SUP users made trips to restaurants. If the SUP didn’t exist, would those people starve? Would the $1.72 instantly evaporate if the SUP went away? No – people would quickly find alternatives.
A good question you should always ask yourself is “compared to what?” Imagine we used this same methodology to evaluate the economic benefits of a road through a similar study. We survey people that drive on the road. Where are they going? How often do they use it? There are a lot more road users per square inch of road than a SUP – it’s pretty easy to see that the $1.72 number would be DWARFED by the same number for a road. A lot of people use the road to drive to work. Do we say that the road created that job?
No that would be absurd.
I wonder how much we paid for this study – it makes us all look silly and probably ultimately shows more evidence against a greenway than for it.
1 comment
You put your most important point nearly last. To calculate the return on investment, we would need to know what incremental spending (and more importantly, economic benefit) occurred because of the greenway. My guess is that it is close to zero.
Even incremental spending is not quite right. A better way to think about it would be: If the greenway had not existed, what would people have done with their money? In most cases, it is probably the same thing — they would have bought groceries, food, etc. No difference for the economy there.
Perhaps they are saving some gas money (pennies per trip) and spent that money on something else. Or perhaps they would have bought video games instead of running shoes. While you can debate the relative merit of these different purchases, it is hard to argue that one is better for the overall economy than another.
Or what if they didn’t spend it at all? What if they saved it? Savings also helps our economy, and you often see articles about how US savings rates are lower than other countries (https://www.marketwatch.com/story/why-americans-are-some-of-the-worlds-worst-savers-2016-04-14).
Plus when you look at macroeconomics, investment is driven by savings and investment is the “I” part of the GDP calculation of C + G + I + (X – M). So investment helps our economy equally with spending the “C” or consumption part of our economy. I am not a huge fan of using GDP to represent the economy but it is the most commonly used measure. https://www.thebalance.com/what-is-gdp-definition-of-gross-domestic-product-3306038
So what is a better way to evaluate infrastructure projects, such as roads, bridges, and greenways? These projects economically benefit us when they increase our productivity. Productivity, from an economic perspective, is to produce more output per unit of inputs. If a road makes it possible for us to produce more per person per year, that is good for the overall economy. If a new highway reduces driving times, it could get goods to market more quickly, allow more time for workers to produce rather than commute, reduce the gas required for these things, etc. These would improve the overall productivity of the workforce. It is hard to see how greenways would improve productivity much. They would reduce productivity if they cause people to take longer to get to their destination, and increase productivity if they allowed people to get to their destination with less gas. The amounts in either direction are probably very small, so the economic effect of greenways is probably close to zero.
Another important point is that greenways could have non economic benefits such as increased exercise, happiness, socialization, etc. and we could decide that these non economic benefits are worth the cost. But the claim you are refuting is that these greenways have an economic net benefit.
The reported cost of the greenways was very low, you are right, although they may not have paid for the land cost — I wonder if the railroads donated it in the case of rails to trails like the ATT.
It seems like the cost information, with a fair amount of detail, should be publicly available but I couldn’t find it. I did find a few articles that had varying costs per mile of anywhere between $400K and $1M per paved greenway mile. I did find a couple of articles:
The bridge on the ATT over I-40 cost $9M in and of itself: http://wunc.org/post/american-tobacco-trails-i-40-pedestrian-bridge-goes-weekend#stream/0
And Wake County reports greenway costs of $1m per mile: http://wunc.org/post/expanding-wake-greenways-costs-1-million-mile#stream/0