(Note: this post is adapted from the Trading Success Roadmap.)
“What metric should I look at to determine if my trading strategy is good enough to start trading it?”
I get this question a lot.
Many traders go overboard here by looking at all sorts of fancy (i.e. complicated) metrics and trying to find the perfect one. It’s easy to fall into analysis paralysis at this stage by obsessing over this metric or that.
The important thing to remember is any aggregate metric, by definition, hides many of the underlying details of a strategy.
When comparing trading strategies, I like to keep it simple. Here are the metrics I’ll look at (in no particular order):
- Profit factor (sum of winning profit / -(sum of losing profit))
- Win rate (number of winning trades / number of total trades * 100)
- Average Profit per Trade (total profit / number of trades)
- Total Profit
- Total number of trades and specifically trades per day
The Most Important “Metric”
By far the most important “metric” that I look at is a visual representation of the equity curve. This is a simple line graph with the date on the X-axis and the cumulative profit on the Y-axis. Here’s an example where I compared three different systems in one simple graph:
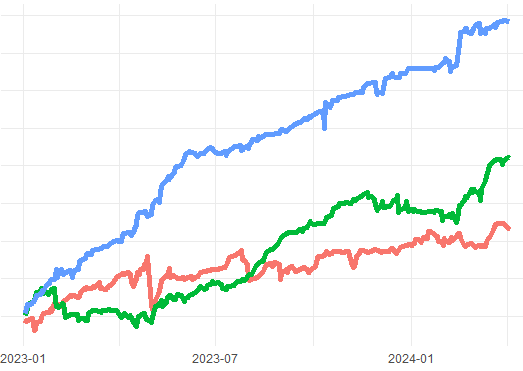
Notice all the details that you can see that are hidden when you only look at a single metric like Profit Factor.
You can see the drawdowns and when they occurred.
You can see the large spikes up and down.
In short, you can see what it will actually feel like to trade the strategy.
There is no substitute for examining the equity curve.
A strategy with a smooth equity curve will have different ways to scale up in size over time.