When troubleshooting Amibroker performance, there’s a valuable tool that most users don’t know about or appreciate.
It’s called a code profiler.
Developers might recognize this type of tool from other languages (for example, Visual Studio includes an excellent one for C#).
A code profiler tells you all the function calls your program is making and how resource-intensive each one is.
This is invaluable for tracking down performance issues.
In Amibroker, it’s available in the AFL Formula Editor window by going to Tools and choosing the Code Check & Profile menu item.
Here’s the report from an AFL file I’m working on now:
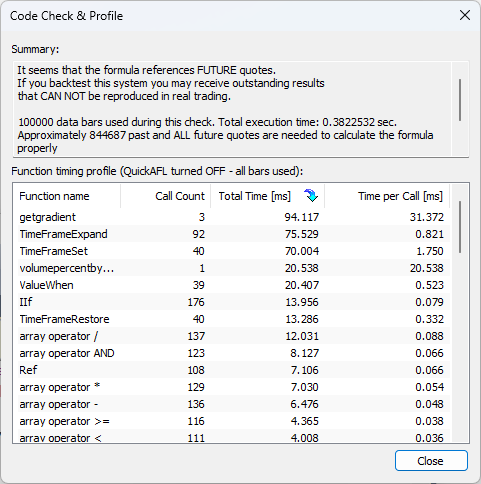
I can see that the GetGradient function is only called 3 times, but the time spent in that function is 94ms, the most of any function called.
This allows you to quickly track down which functions are causing the biggest delay in your code.
Typically, this doesn’t matter THAT much for backtesting, but when you start using Amibroker to trade in real-time, it becomes very important.
-Dave