Yesterday, I showed the mistake most traders make when trying to formulate a strategy based on a stock chart.
A few readers responded with their thoughts on the RTX chart in that post.
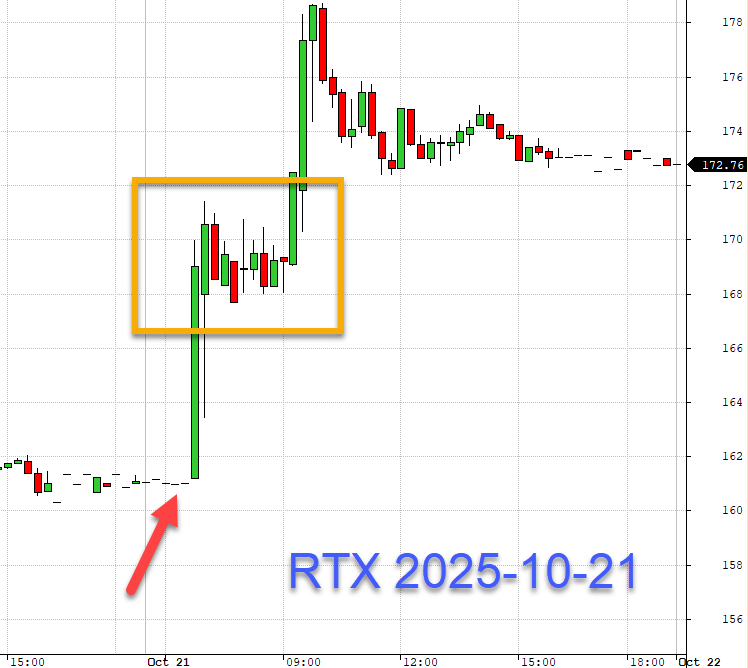
Let’s brainstorm some ways to create a strategy based on that chart.
Here are a few ideas that come to mind from this one example. Here’s the chart again for reference, ideas follow:
Strategy Ideas:
- Find an alert in the first tall green bar (probably a new high alert with some volume)
- After the first tall green bar, go long the pull back in the second green bar with the long wick
- Fade the initial move by finding a threshold that the price has gone up too far
- After the first two green bars, a consolidation forms. Go long the breakout of that consolidation.
- Go short the breakdown of that consolidation (wouldn’t have triggered in this example, but easy to find other examples that would have)
- A hammer bar forms in the consolidation (the 10th bar in the yellow box) – go long the break of that candle
- Short the subsequent move up (above the yellow box)
There are seven ideas to test from this one chart.
Can you think of others?
Each of these ideas is easily testable in Amibroker, and some can be modeled in Trade-Ideas.
The point here is not whether these ideas would have worked in this particular RTX example.
The real value is creating ideas from this chart to apply across the entire market.
Anyone interested in testing one of these ideas and sharing the results with the list?
If so, hit reply and let me know. I’ll give you a free month of Strategy Cruncher access to do a case study.
-Dave