Unless you’ve been hiding under a rock for several weeks, you’re probably aware of ChatGPT, the chat-based AI service from Open AI. It can do some pretty powerful things, and I use it a lot in my daily tasks. For example, I’ve replaced 60+% of my Google searches with queries of ChatGPT and it’s been a huge time saver.
But can it create a trading strategy? And not just any trading strategy, but one that’s actually profitable?
I’m currently trading 15 strategies live that I’ve created outside of ChatGPT and I’ve helped dozens of traders create their own profitable trading strategies. After using ChatGPT to create another strategy which I’ll show below, I’m convinced it can be used to:
- Reduce the amount of time and work it takes to create a trading strategy
- Give solid directions to help you improve your trading strategy
Read on to see how I used it to create a simple, profitable trading strategy and be sure to subscribe to my free email newsletter that teaches you how to come up with your OWN trading strategy.
Initial Prompts to Create a Trading Strategy
I first asked ChatGPT a very simple question:
My Prompt: Can you help me come up with a trading strategy to backtest?
It responded in its typical enthusiastic fashion and suggested a Moving Average Crossover trading system:
ChatGPT: Of course! I’ll provide you with a simple moving average crossover strategy to backtest. This strategy is based on two moving averages: a short-term (fast) moving average and a long-term (slow) moving average.
Here’s the basic outline of the moving average crossover strategy:
- Choose a financial instrument: Pick a financial instrument to trade, such as stocks, ETFs, or currency pairs.
- Select time frame: Choose a time frame for your analysis, such as daily, hourly, or minute-by-minute data.
- Define the moving averages: Select the lengths of the two moving averages. A common choice is the 50-day (short-term) and 200-day (long-term) simple moving averages (SMAs).
- Entry and exit signals:
a. Buy signal: When the short-term moving average crosses above the long-term moving average, it’s a signal to buy (go long).
b. Sell signal: When the short-term moving average crosses below the long-term moving average, it’s a signal to sell (go short or exit a long position). - Risk management: Define your risk management rules, such as setting stop losses and position sizing, to protect your capital.
- Backtesting: Use historical price data to simulate the performance of your strategy over a specified period. This will help you evaluate the strategy’s profitability and risk.
You’ll notice that although the first attempt is a very common strategy that isn’t unique at all, the overall plan here is not that bad. All the steps are things that you’ll eventually need to do to create your own trading strategy. I wanted something a lot more unique than this though. Here was my next prompt:
My Prompt: That one seems a little simple. Can you suggest another entry signal that is more unique?
ChatGPT Response: Sure, I can suggest a more unique entry signal using the RSI (Relative Strength Index) indicator combined with Bollinger Bands. This strategy aims to identify potential overbought and oversold conditions for better entry and exit points.
Here’s an outline of this trading strategy:
- Choose a financial instrument: Pick a financial instrument to trade, such as stocks, ETFs, or currency pairs.
- Select time frame: Choose a time frame for your analysis, such as daily, hourly, or minute-by-minute data.
- Define the indicators:
a. Bollinger Bands: Typically, Bollinger Bands are calculated using a 20-day simple moving average (SMA) and a 2 standard deviation range. You can adjust these parameters based on your preferences.
b. RSI: The Relative Strength Index is a momentum oscillator that measures the speed and change of price movements. It ranges from 0 to 100. A common setting for RSI is a 14-day period. - Entry and exit signals:
a. Buy signal: Look for a situation where the price touches or goes below the lower Bollinger Band and the RSI value is below 30 (oversold condition). This may indicate a potential buying opportunity.
b. Sell signal: Look for a situation where the price touches or goes above the upper Bollinger Band and the RSI value is above 70 (overbought condition). This may indicate a potential selling opportunity. - Risk management: Define your risk management rules, such as setting stop losses and position sizing, to protect your capital.
- Backtesting: Use historical price data to simulate the performance of your strategy over a specified period. This will help you evaluate the strategy’s profitability and risk.
This suggestion is a lot more unique and uses a combination of two indicators to form an entry signal, a break of the Bollinger Band in addition to a relatively extreme value for the Relative Strength Index. At this point I’m still skeptical, but I decided this was good enough for my purposes, so I decided to continue with this basic strategy.
Backtesting the ChatGPT Trading Strategy
As instructed, I chose my financial instrument to trade. My specialty is trading in US equities, so my plan would be to eventually trade the strategy there, but at this stage of my research into a new strategy, I test it on SPY to get a rough sense of how many trades the system will take, how profitable the trades are, etc. This saves time and you can iterate quickly before applying the strategy to a larger universe.
I mostly trade intraday, so I started on the 5 minute timeframe but after some quick testing decided to move to the 15 minute timeframe for this type of strategy. I chose to focus just on the long side for now. How long will I hold the trades? This type of mean reversion trading system needs some time for the trades to play out, so the idea would be to watch for these entries at the beginning of the day, enter the trades, and then hold until just before the close. Here’s the first version of the strategy. It has 628 trades with a profit factor of 1.1 and a win rate of 50.6%. While it is technically profitable, it’s nowhere near anything that I’d like to trade.
So I asked ChatGPT how I could improve it.
Improving the Trading Strategy
My Prompt: OK, I’m looking at the Bollinger Band/RSI system you suggested. I’m getting in early in the day and exiting just before the close. It’s not really profitable. What filters do you suggest I use to take fewer but more profitable trades?
Here’s how ChatGPT responded:
ChatGPT: It’s essential to fine-tune your trading strategy to achieve better profitability. Here are some filters you can consider adding to the Bollinger Band/RSI system to increase the likelihood of more profitable trades:
- Trend confirmation: Add a moving average or another trend-following indicator to confirm the overall trend direction. For example, you can use a 200-day simple moving average (SMA). Only take long trades when the price is above the 200-day SMA (uptrend) and short trades when the price is below the 200-day SMA (downtrend).
- RSI level adjustment: Adjust the RSI overbought and oversold levels to increase the selectivity of your entry signals. For example, you can use 80 and 20 instead of 70 and 30. This way, you’ll only enter trades when the market is more extremely overbought or oversold.
- Bollinger Band width filter: To avoid trading in sideways or consolidating markets, you can add a filter based on the width of the Bollinger Bands. Calculate the Bollinger Bandwidth as the difference between the upper and lower bands divided by the middle band (20-day SMA). Only take trades when the Bollinger Bandwidth is above a certain threshold, indicating higher volatility and stronger trends.
- Volume confirmation: Add a volume filter to confirm the strength of the price movements. For example, only take trades when the volume is above the 50-day moving average of volume. This helps to filter out potential false breakouts or weak price movements.
- Time of day filter: Limit your trading to specific hours of the day when the market tends to be more active and have higher liquidity. For example, you can focus on the first two hours after the market opens and the last two hours before the market closes, as these periods often experience higher volatility.
- Support and resistance levels: Incorporate support and resistance levels into your trading strategy. Look for price action near key support and resistance levels, as they can act as a confirmation for the Bollinger Band/RSI signals. For instance, a bounce off a support level combined with an oversold RSI signal could strengthen the case for a long trade.
The trend confirmation suggestion is probably the best route to take, but for simplicity’s sake, I chose the RSI level adjustment. Its original suggestion was to use an oversold threshold of 30 for the RSI. I took its advice and changed the threshold to 20 which should yield fewer trades since the oversold value would be far more extreme.
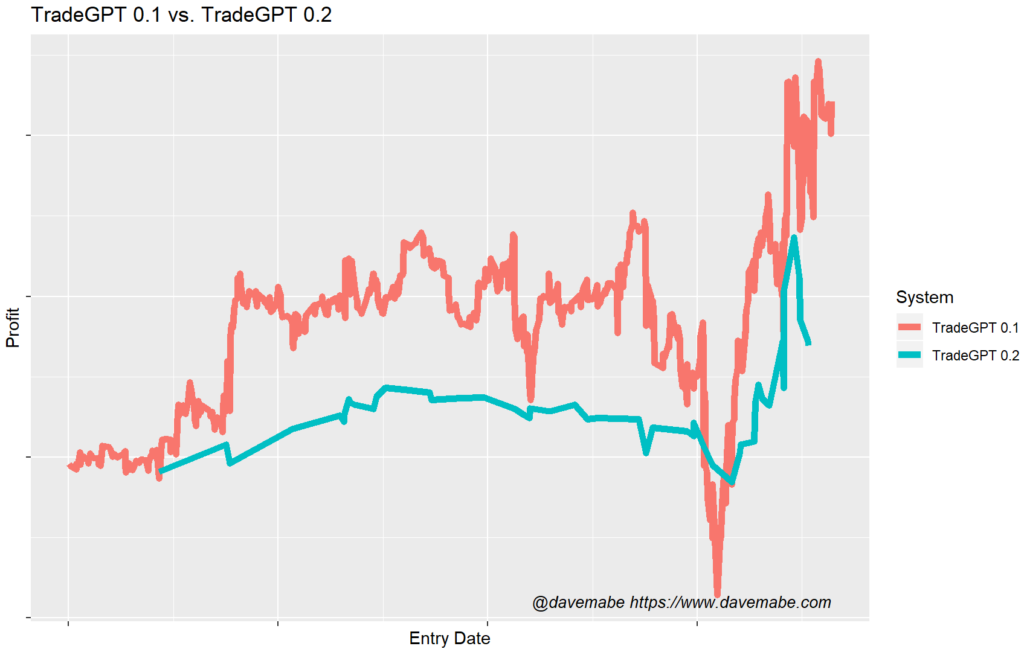
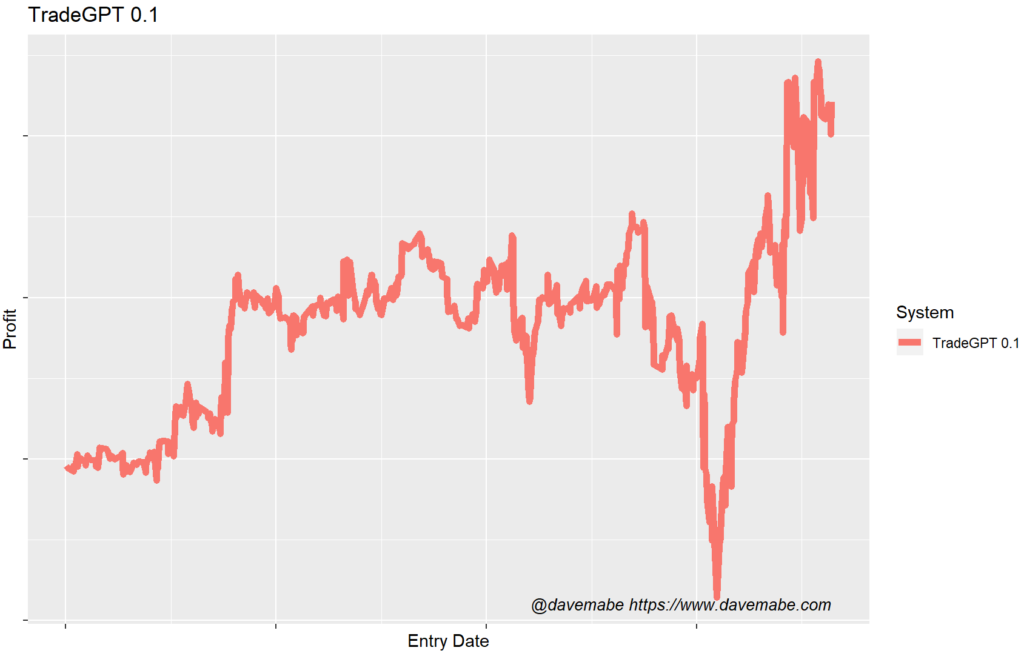
ChatGPT Trading Strategy Version 0.2 of the strategy at first glance looks worse, but it’s actually quite a bit better. There are over 90% fewer trades and the trades that remain are more profitable. When you start applying this to a larger universe that’s going to make a big difference.
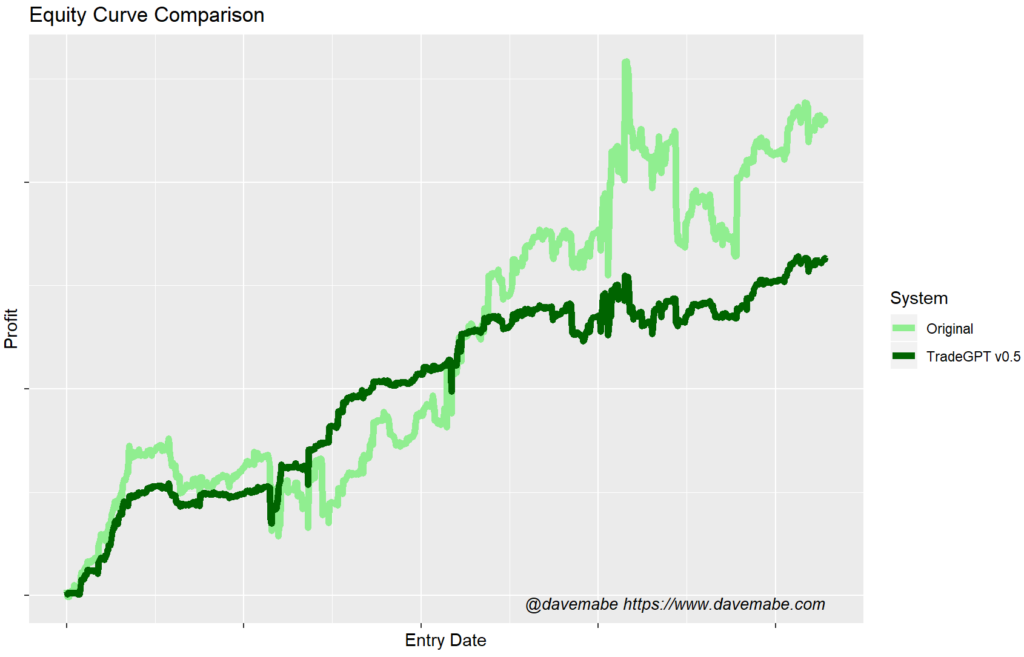
That’s exactly what I did next. Instead of just SPY for my proof of concept, I applied it to one of my lists of 450 symbols. Here are the results for the RSI threshold of 30 which I’m calling TradeGPT Trading Strategy version 0.3:
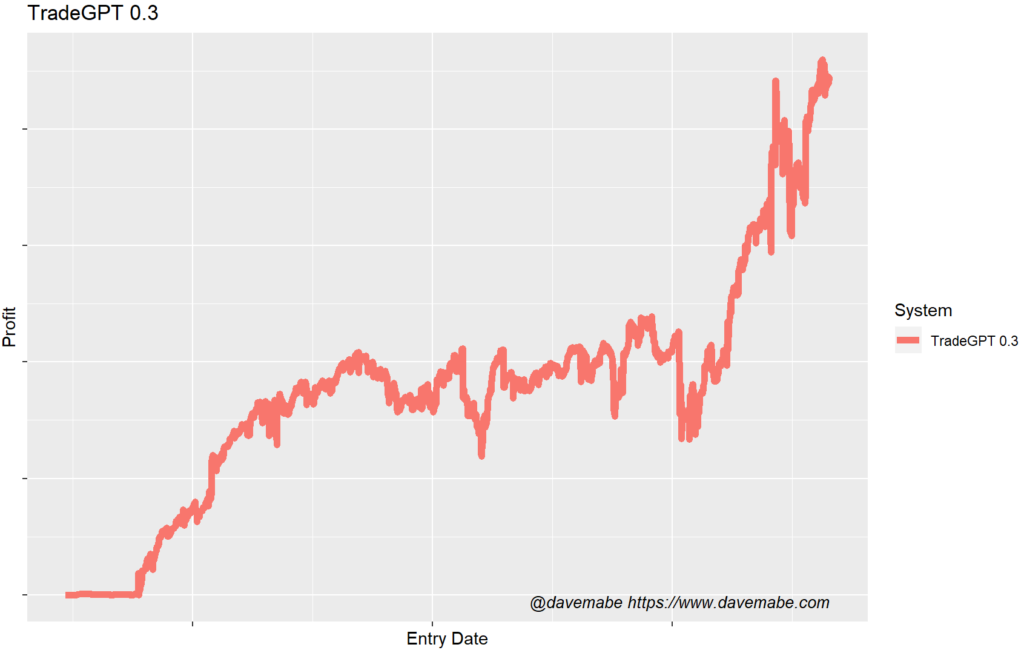
Starting to look not bad. There are a TON of trades in there though, so let’s use a more extreme level of RSI to get rid of a lot of the noise as ChatGPT suggested above.
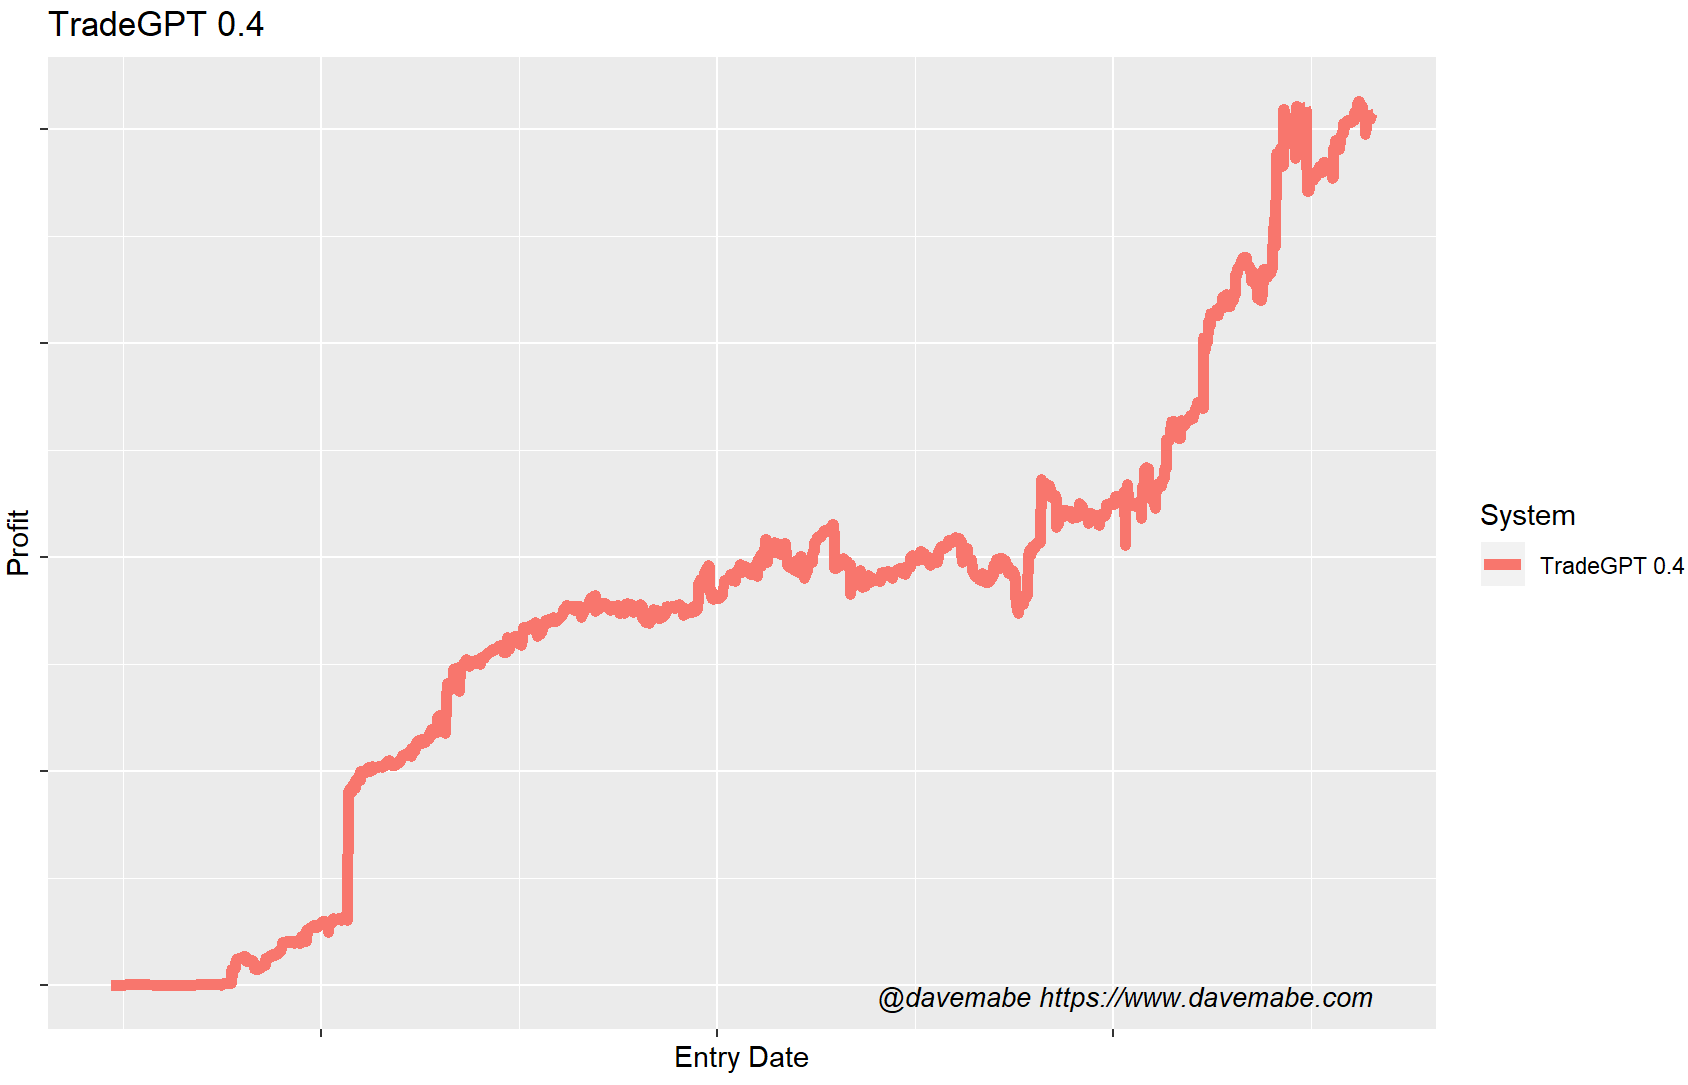
Here’s the same strategy with a threshold of 20, ChatGPT Trading Strategy version 0.4:

While this strategy is not quite tradeable yet, it’s pretty impressive progress for just a few minutes with ChatGPT! Some traders won’t ever get to even this point with a trading strategy and now you can get to a very good starting point really quickly.
Trend Confirmation Filter
Trends, of course, can mean different things to different traders. My goal here is to come up with a strategy as quickly as possible, so I chose a filter that would be quick to implement and test. The filter is ATRs away from the 200 period moving average. So in pseudocode:
(Entry - MA200) / ATR
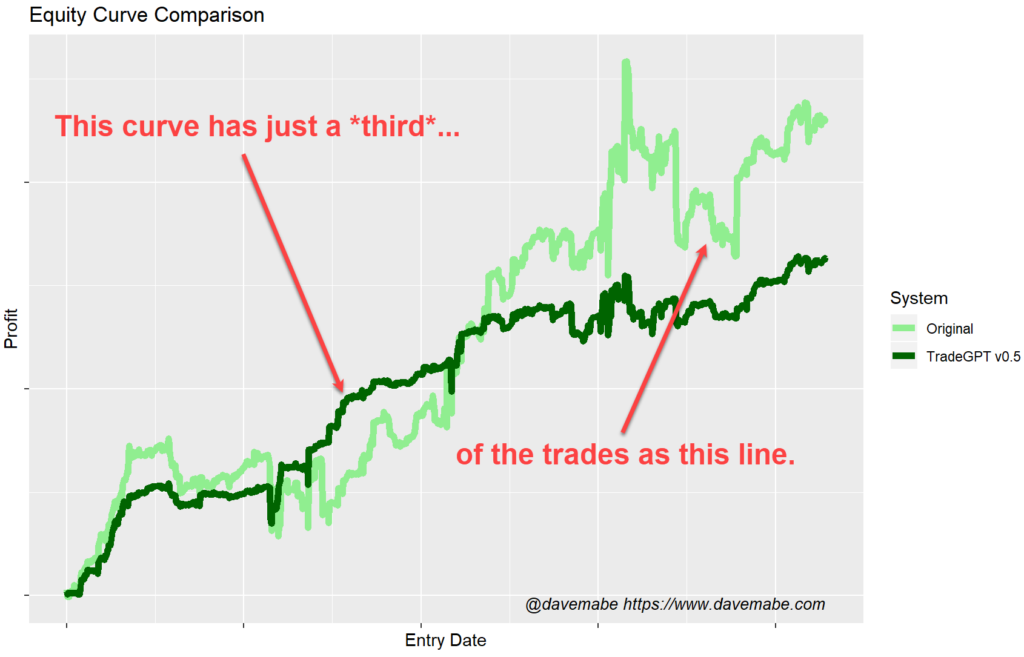
Where MA200 = 200 period moving average and ATR = average true range. Why use average true range and not just distance? Imagine a high priced stock like $META (currently $239) versus a low priced stock like, say $PTON (currently $9.26). A $1 move in $PTON is going to be a lot more dramatic than a $1 move in $META. Using ATR like this normalizes that movement. When I looked at this filter, I found that the further away the price was from the moving average, the more reliable the signal seemed to be:
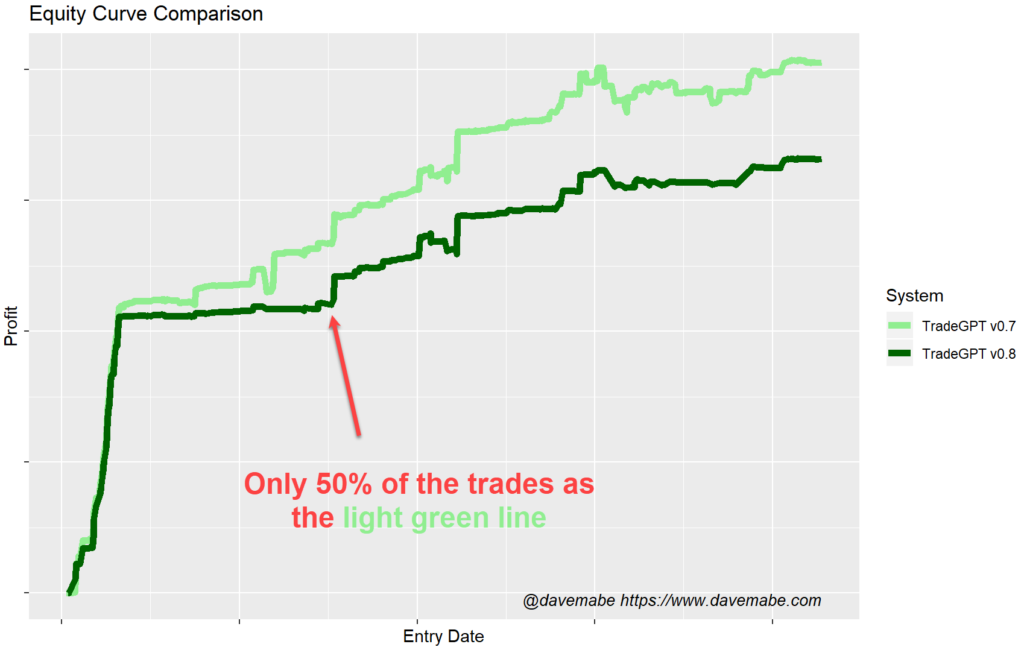
And remember, the dark line is lower, but it has a lot fewer trades so the strategy is significantly improved. In general, I’m looking for a smoother equity curve and more efficiency so although the dark green curve is lower, it’s FAR better than the top one because it has almost the same amount of profit with just a third of the trades.
Time Of Day Filter
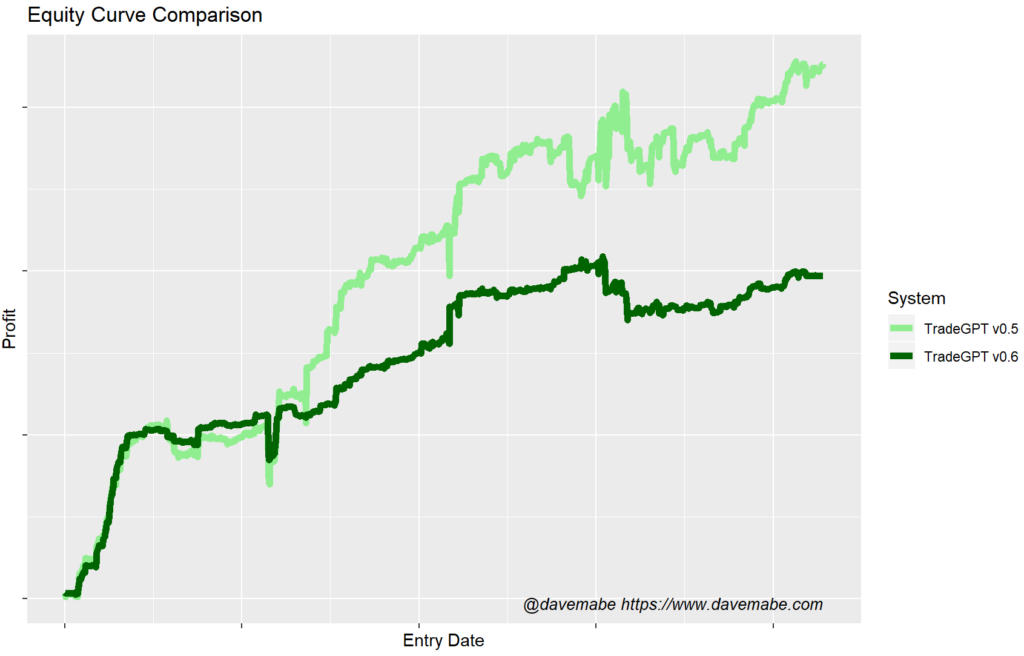
Another suggestion from ChatGPT was to look at the time of day that the signal occurred. I know from experience that this is typically a good suggestion. Entries too late in the day won’t give the trade enough time to play out before the close and I suspect that entries too close to the open could easily turn out to be false positives.
Sure enough, it looks like skipping the first bar of the day makes sense as predicted by ChatGPT – notice the dark green curve continuing to smooth out:
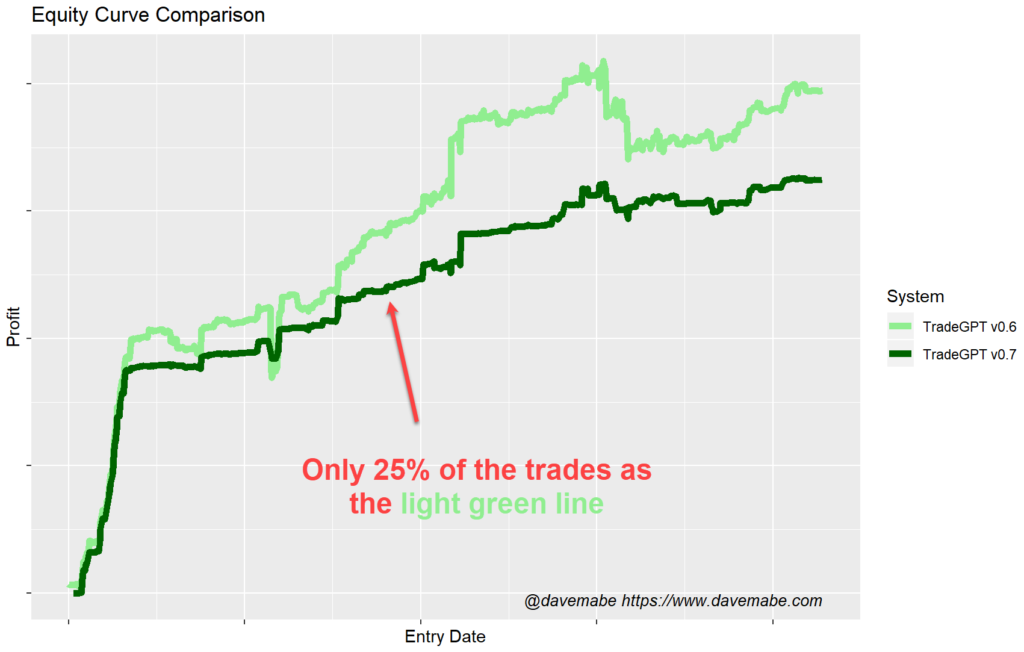
RSI Level Adjustment
ChatGPT suggested looking at the RSI (Relative Strength Index) level for the signal. Let’s see if a more extreme level makes sense. Again, at first glance, it doesn’t seem that different but it’s almost the same profit with only 25% of the trades. The quality of the equity curve is getting better and better.
Support and Resistance Levels
Like “trend”, support and resistance are often in the eye of the beholder. It would be impossible to identify exact, custom support and resistance levels for each of the hundreds of trades remaining in this backtest.
I want to be completely automated, so what I would normally do at this point is to start reviewing a lot of charts to try to detect a pattern of general support and resistance that could be tested across all the trades. That won’t work for the purposes of this experiment – I’m trying to come up with a profitable strategy using ChatGPT as quickly as I can.
To capture a lot of what ChatGPT is suggesting here with as little time as possible, I decided to look at the range of the previous day. For example, if the entry is below yesterday’s low then it might be beyond any support. If it’s near or in yesterday’s range, it could be more likely that it’s running into support which would make it more likely to revert to the mean. To quickly see this in aggregate across a backtest, I created a new data point in each trade to examine. I’m calling this Position in Yesterday’s Range:
(Entry - Yesterday's Low) / (Yesterday's High - Yesterday's Low) * 100
A value of 100 means it’s right at Yesterday’s High. A value of 0 means it’s right at Yesterday’s Low. A value of -100 means it’s below Yesterday’s Low by an amount exactly equal to Yesterday’s Range (Yesterday’s High – Yesterday’s Low).
It turns out there is a threshold that makes sense. The entry price needs to be beyond the low from yesterday, but not by an excessive amount.
The equity curve is smoother still – more trades without sacrificing that much overall profit. It’s starting to look like something that might be worth trading.
To learn how to create your own trading strategies, sign up for my free trading course.
2 comments
Any updates to the ChatGPT Strategy?
@sam see this post which has some updated content. The mailing list will have the most up to date info.
https://www.davemabe.com/my-chatgpt-trading-strategy-finding-more-edge/
Comments are closed.