Following up on yesterday’s post called Filters Are Everything, today we’ll look at why adding a column to your backtest is so powerful.
Remember, your system is trading new highs. After observing a few trades, you notice that some are way above their 50-day moving average, while others are below.
You know that many traders pay attention to the 50-day moving average, so surely this data point has some effect on the system.
How can you tell for sure?
Here’s what most traders try (and why they continue wasting time going in circles with their backtests).
They add a line of code like this:
# check if price is less than the 50 day moving average.  If so, skip it.
if price < fifty_day_sma:
   return
And they run another backtest. It results in a subset of the original trades. But the rule they tried didn’t remove as many trades as they assumed.
And it didn’t improve the system at all.
Most of the new highs are already above the 50-day SMA, so a simple above/below rule won’t have much effect.
So they try this:
# check if price is less than 10% above the 50 day moving average.  If so, skip it.
if price * 1.1 < fifty_day_sma:
   return
And the wasteful “guess and check” backtesting loop begins as they try different values for the distance from the 50-day SMA over and over in a futile attempt to randomly stumble upon the “right answer.”
Backtesting, when done properly, should be saving you time, not wasting it in this endless rabbit hole.
The much smarter way to answer the question about the 50-day SMA, is to add a column to your existing backtest – a data point for the distance to the 50-day SMA.
Then, figuring out the best filter to use for your strategy is not an endless “guess and check” loop – it’s a quick verification of the right value to use.
The value that’s optimal for your trading system.
And you can get the optimal value by running a single backtest, not dozens.
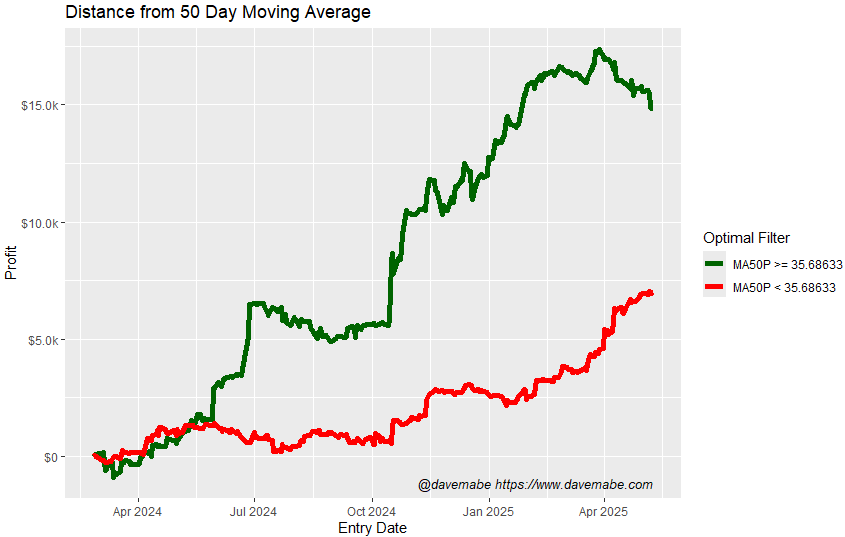
Here’s the answer for one of the strategies I trade:
Optimal Value for Distance from 50-Day SMA
From just one backtest, I can see that the optimal value for this particular strategy is 35. (Note that this value will be different for your strategy.)
The green equity curve in the chart above represents all the trades where the value is above 35, and the red line contains those below.
Applying this single rule to my strategy gives me:
- Higher total profit
- Fewer trades (which means lower commission and less risk)
- Higher win%
- A better equity curve
- Fewer and shallower drawdowns
Announcement: I’ll be releasing a new tool soon that allows you to quickly and effectively make your trading strategy significantly more profitable. Click the button below to be notified when it’s released and get early bird pricing.
Stay tuned!
-Dave