After Brian Shannon’s tweet the other day about new lows in markets below the 200-day moving average, I thought I’d start doing some research on the subject of moving averages in the overall market.
Streaks of Rising vs. Falling 200 DMA
First off, here’s a list of the longest streaks with a rising 200-day moving average in SPY. Notice how the second-longest streak just ended towards the end of October.
- 08/15/2015: 665 days
- 10/23/2018: 607 days
- 10/14/2014: 367 days
- 11/19/2017: 351 days
- 08/08/2011: 231 days
Here’s a list of the longest streaks with a falling 200-day moving average:
- 07/27/2009: 392 days
- 04/29/2003: 315 days
- 01/07/2002: 230 days
- 04/14/2016: 75 days
- 01/27/2012: 60 days
Notice the length of these two sets of streaks. The streaks with a falling MA are just so short compared to the streaks with a rising MA. Of course, there is a strong positive bias in the market, so this is exactly what you’d expect to see. It’s still striking to look at the numbers this way. The 75-day streak that ended on 04/14/2016 is fourth on the list! Most traders just don’t have much experience in a bear market.
Here’s another visualization that puts this in perspective:

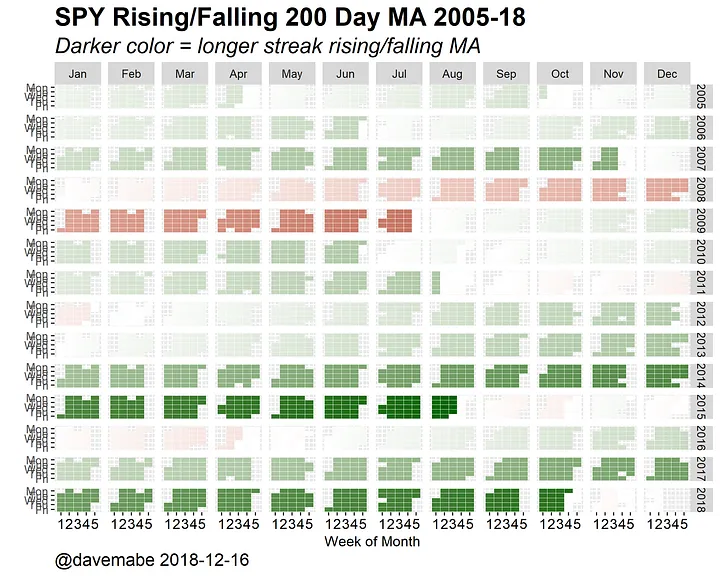
The above chart shows every trading day since 2005. Green days indicate a rising 200-day moving average, and red days indicate a falling 200-day moving average. The darker the shading, the longer the current streak. There’s a lot of green there! Nothing of real significance in almost a decade. What percentage of current traders do you think have been trading longer than 9 years? It has to be low.
The Edge with Rising/Falling 200 Day MA
Is it really true that we’re more likely to make new lows when the price is below a falling 200 DMA as Brian says? Is it one of those market truisms that everybody says but doesn’t really stand up to scrutiny?
It turns out that it IS true — but how much? How strong is the effect?
When the price is below a falling 200 DMA, on average the next day’s low will be 0.029% lower. When the opposite is true — that is, the price is above a rising 200 DMA, on average the next day’s high will be 0.049% higher.
What About the 50-Day MA?
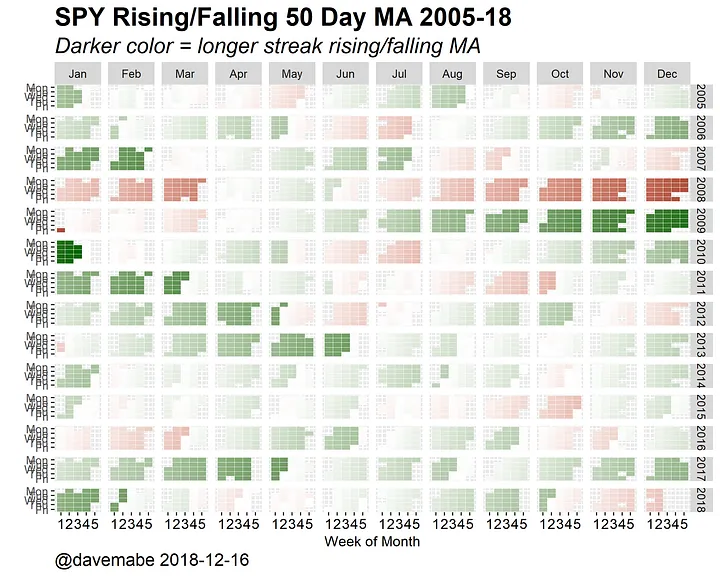
The 50-day moving average is shorter, so it “catches up” quicker to the most recent price, so we’d expect the streaks of rising and falling MAs to be shorter. This is exactly what we see.
Longest streaks of rising 50-day MA in SPY:
- 01/22/2010: 189 days
- 03/16/2011: 134 days
- 02/27/2007: 133 days
- 03/11/2004: 133 days
- 05/11/2017: 119 days
Longest streaks of falling 50-day MA in SPY:
- 01/05/2009: 143 days
- 10/01/2002: 105 days
- 04/01/2008: 96 days
- 01/26/2001: 90 days
- 11/15/2001: 89 days
It’s easy to see how bad 2008 was in this chart — the two longest streaks of falling 50 DMA with most of the days in the same year.

What about the edge versus the 200 DMA? When the price is below a falling 50-day MA, the low on the next day is on average 0.045% lower than the previous day. When the price is above a rising 50-day MA, the high on the next day is on average 0.068% higher. The effect is even stronger with the 50 than with the 200. I’ll take a look at shorter moving averages in a future post.
(If you like this post, you’ll probably like my Twitter feed where I post different SPY-related charts each day depending on the market situation in the #SpyWhatsNext hashtag.)