
This is the third in a series of articles summarizing the monthly trading strategy article in the Technical Analysis of Stocks and Commodities monthly magazine.
System Type: Range trading
Author of article: Slawomir Bobrowski, no Twitter or online presence that I could find other than this strange article about a trading system based on a passage in the book of Deuteronomy.
Like Pivot Points, but Different
Pivot points are a fairly common method traders use to define significant support and resistance levels based on the previous day’s trading session. They are several levels that are typically used: S1, S2, S3, etc for support levels (below the price) and R1, R2, R3, etc for resistance levels (above the price). S1 and R1 are the closest to the price and the larger the numerical value in the pivot point the further away that point is.
Camarilla Points are based on the same concept but:
- Use different formulas for the price levels
- Can be applied to a range of prior days rather than just the previous day
Here are the formulas for the camarilla points:
- R5 = (High / low) * Close
- R4 = Close + Range * (1.1)/2
- R3 = Close + Range * (1.1)/4
- R2 = Close + Range * (1.1)/6
- R1 = Close + Range * (1.1)/12
- S1 = Close – Range * (1.1)/12
- S2 = Close – Range * (1.1)/6
- S3 = Close – Range * (1.1)/4
- S4 = Close – Range * (1.1)/2
- S5 = (Close -(R5-Close))
Strategy for Trading the Camarilla Points
Here’s a chart that shows the points on a chart of the Dow from 2012. The idea of the system outlined in the article is that you wait for the price to reach R3 or S3 and trade that move until it reaches the opposing point. S4 and R4 are used as breakout triggers — that is, you trade with the move (in the image above, short at [3], buy at [4]).
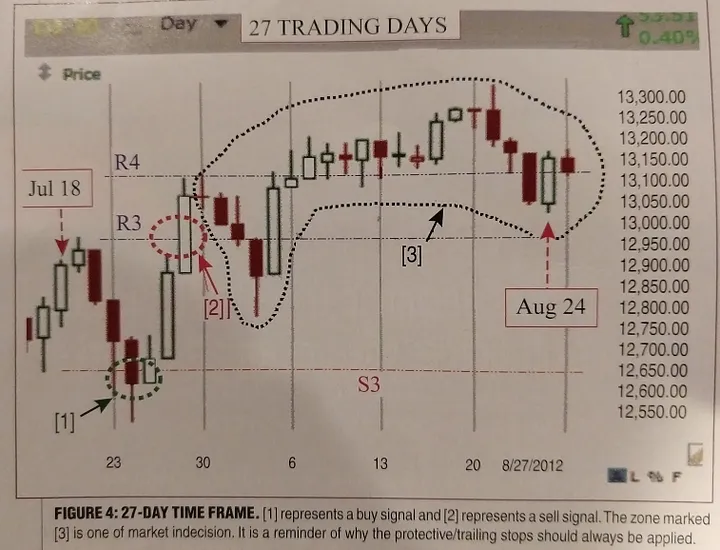
The R3 and S3 levels typically seem to be fading a move like in this example. Buy at [1], sell at [2].
My Takeaways
I’ve always pretty much ignored pivot points. I know a lot of traders pay a good bit of attention to them and some of them are quite successful using them. Here’s why I’ve ignored them up until this point.
The pivot points are derived from the actual price levels from the previous day. Why focus on data points that are one layer of abstraction away from the actual source of the pivot points? At least start with the actual previous day’s prices (open, high, low, close) directly and see if those affect system performance. This is why I focus on the previous day’s close, high/low, and open in that order. The more recent price level is more important, so the previous close is significantly more important than the previous open.
However, as more and more traders look at a derived data point, the more you should be willing to pay attention to it simply because of the decisions traders are making based on it. For example, common moving averages (50, 200) are typically more important than a more obscure indicator that nobody has heard of.
As far as I can tell, pivot points don’t meet that attention threshold for me. Where does that leave the camarilla points? Given the fact that I’m guessing not a single person that reads this article will have heard of them, then the attention traders give it is minuscule or non-existent. Also, the arbitrary nature of the formulas and timeframe you apply it to make it seem weak — for example you could take any chart and come up with a timeframe for the camarilla points that works well.
My TODOs
So I’ve dismissed the camarilla points. Does that mean this was a worthless exercise? I don’t think so. It does spurn me to take a closer look at the standard pivot points and see if they have any affect on my trading systems. The nice thing about backtesting is that you can come up with a prediction about some aspect of the markets and test it. My intuition tells me that the previous days price points matter more than the pivot points. I’ll do some testing and report back my results.