
A trader friend of mine was attending a webinar this week and sent me this chart from one of the slides that was being presented.
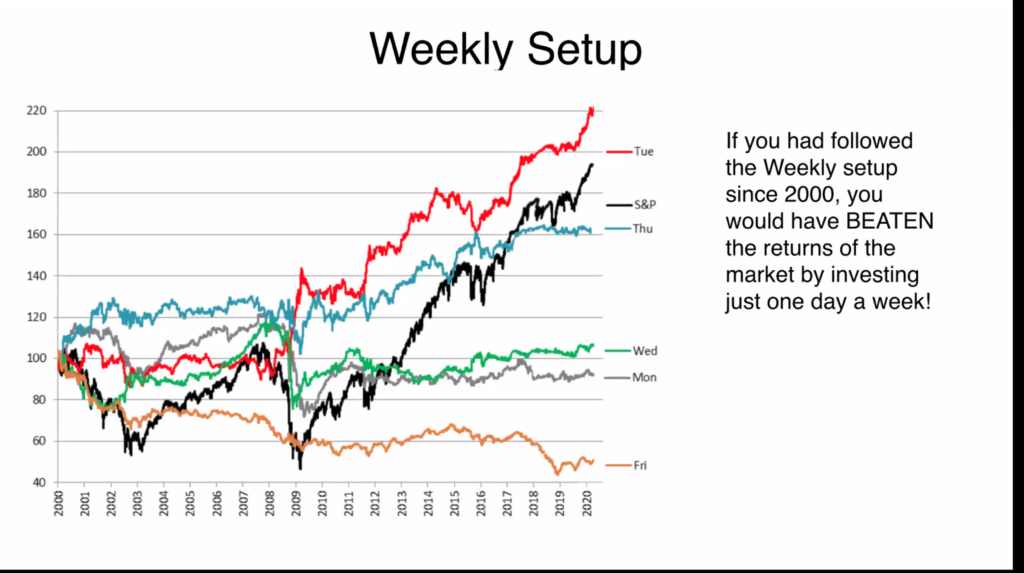
The chart clearly shows that there is a wide variety of resulting performance based simply on the day of the week that the trades were initiated on. The data doesn’t lie, right? Of course the data isn’t outright LYING but it is certainly setting a trap that is easy to fall into.
Here’s why the day of the week data trick is so tempting but ultimately meaningless.
The “Data Doesn’t Lie” Stage of Trader Development
When you first start trading with a statistical perspective it really seems like a super power and in a lot of ways it is. You can predict the future in some sense. Your backtester is a powerful bullshit detector – a huge time saver when you’re honing your trading strategies.
This approach gives you the ability to quickly prove to yourself whether a strategy works or not. It’s a quantum leap forward in trader development and very few traders have the ability to even consider getting to this point.
However, at this stage there is a trap that most traders at this level fall into and can never get out of. I call this the Data Doesn’t Lie Trap.
I was in this trap for several months many years ago. Having so much data at your fingertips is very powerful, but it’s easy to become enamored of the data itself. When a backtest is telling you something, there’s a strong tendency to believe it. The data doesn’t lie!
Here’s what is difficult about this stage: you have to become intelligently skeptical of what the data is telling you. What most traders never fully realize is that while the data doesn’t lie, it presents all sorts of false positives that appear to dramatically affect your trading system but are actually completely meaningless.
The problem with the day of the week indicator is that it’s very easy to come up with a story to convince yourself that it’s meaningful. My system doesn’t trade well on Fridays? I bet I’m looking forward to the weekend and a little bit tired compared to other days of the week. My Mondays look like they’re underperforming? It’s got to be because I’m tired from the weekend and a little irritable.
See how easy it is to fool yourself into thinking the day of the week is super meaningful?
Look at a Random Filter
The day of the week filter is perfectly set up to be one of these false positives. To demonstrate it, let’s look at some equity curves from one of my trading systems. For this example I assigned a completely random value between 0 and 1 to each trade in the backtest. It’s a random value, so there’s literally no reason to expect it to have any impact on the trading system.
But what do we find?
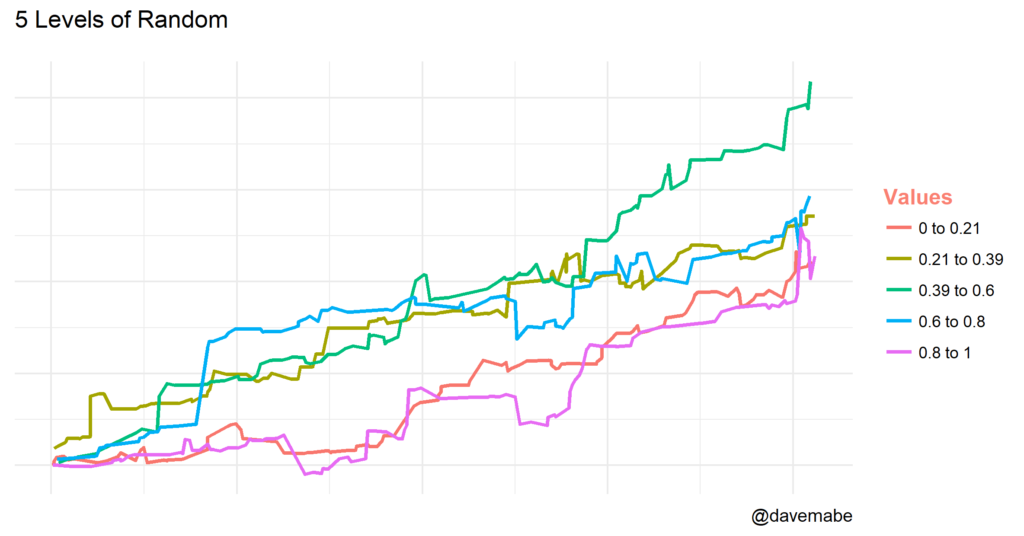
When we look at equity curves based on 5 segments of the random value, you see that one segment seems to be dramatically better than the other segments. Values between 0.39 and 0.60 of our random filter outperform all other values of this filter.
The data doesn’t lie, right?
Of course, I chose 5 different segments for a reason – there are five trading days in a week. If you compare the curves from the random value with the curves from the day of the week chart you see that they don’t look that much different.
It’s very likely that the day of the week filter is just as random as our arbitrarily chosen values in our random filter. But looking at either chart it’s VERY TEMPTING to blindly follow the data and draw conclusions from it.
The day of the week indicator is perfectly set up to yield false positives precisely because there are exactly five trading days in a week. If you segmented almost any system into five buckets it would be surprising if you DIDN’T see random variation.
Can Day of the Week Ever Be Valid?
I can imagine some trading strategies that might be influenced by the day of the week. For example, a strategy could be affected by options expiration dates which occur on Fridays. I also suspect that earnings announcements are clustered around certain days of the week which could affect a strategy.
For most strategies, though, including the ones represented in the charts above, the relationship with day of the week will be meaningless.
Let’s think about it more precisely though. The relationship might not be completely meaningless, but that’s not really the question. The real question is how MUCH of an effect does it have on your trading system? Is the affect strong enough to make trading decisions based on it?
And the even MORE important question is how big is the effect relative to other filters we might want to use in our trading systems?
You can imagine a filter that shows a consistent relationship across time with your trading system, but the effect might be so tiny as to be worthless.
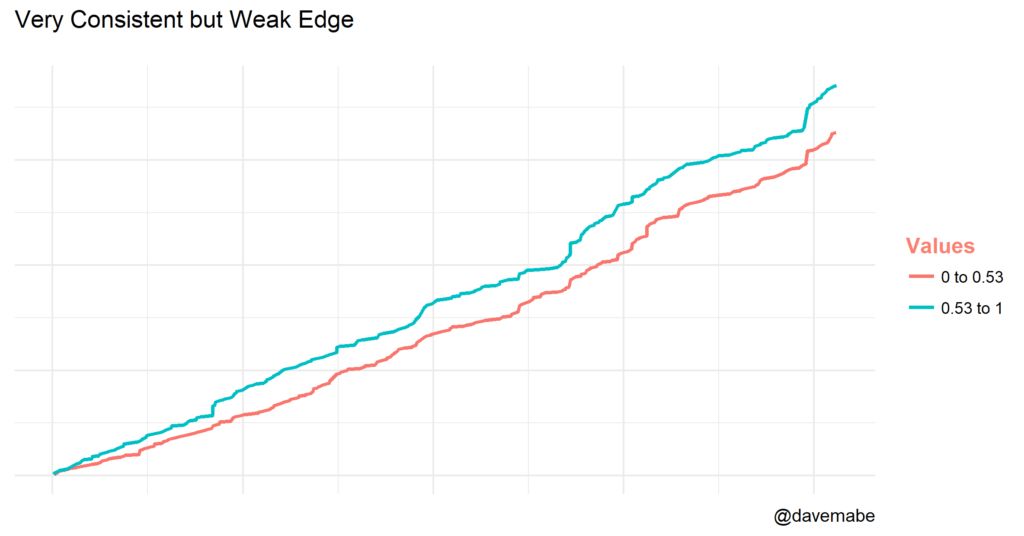
In the chart above, I concocted a hypothetical example to demonstrate. The blue line represents trades that have a slightly stronger edge than the red line using a fake indicator I created with values between 0 and 1. The blue line is very consistently stronger than the red line, but the edge is very slight. Despite the perfect consistency, this indicator would not be a good candidate for creating a rule for our trading system because it just doesn’t provide much value since the edge is so small.
How to Make Sure You’re Not Fooled by Data
The first principle is that you must not fool yourself and you are the easiest person to fool.
Richard Feynman
The above quote by Richard Feynman is one of my all time favorite trading quotes despite the fact that he was not a trader.
The point is you never really know if you’re being fooled by the data! There’s no test you can run to make 100% certain that you’re making the correct choices in designing your trading system.
Definitely a scary thought! The way I think about it, though, is that it’s actually good to have a little bit of doubt in your mind about your trading. A healthy level of humility is actually quite motivating and encourages you to continue to learn and improve your trading. This little bit of worry is the fuel for studying your systems and digging deeper than the average trader thinks is sufficient.
Most people have trouble thinking clearly about uncertainty and risk in general. Understanding and accepting this uncertainty and trading well in spite of it is what will separate you from even the good traders.
What’s Your Vote for the Worst?
Do you have a market indicator that you think is totally overrated? Let me know.