One of the most valuable things I do with traders I coach is give them simple rules to eliminate losing trades from their existing trading strategy.
This is typically the quickest and easiest way to improve a strategy without curve fitting.
Here’s an example of a rule I gave to a trader I’ve been coaching for a few months. (The actual filter and value are anonymized, but the equity curves are real.)
The green line represents the equity curve of the trading system after the rule is applied.
The red line represents the equity curve of the trades that would be excluded.
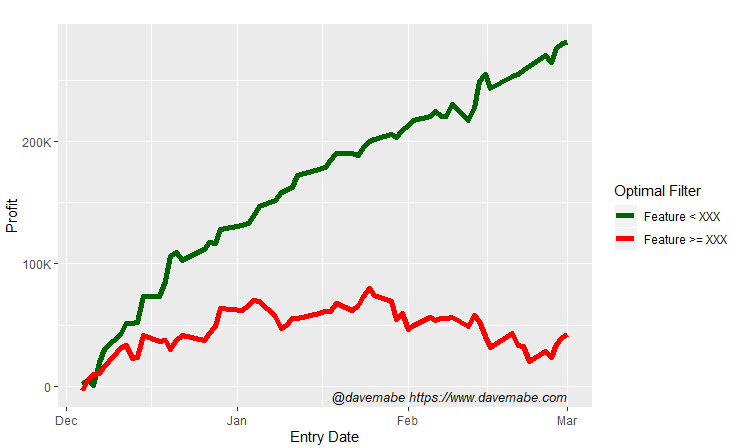
This rule got rid of 30% of the trades in the strategy and increased the profit per trade in the system by 50% – a huge improvement.
When I deliver a rule like this, I always encourage the trader to independently verify it and not just blindly take my word for it.
There’s a convenient way to verify it using Excel, so I thought I’d create a video showing the process.
If you’re not aware of the auto-filter feature in Excel, it’s worth watching and working into your backtesting process – it’s a huge time saver.