I’ve been trading gaps since 2005 with a statistical, data driven approach. I’ve put in a lot of quality time outside of trading hours backtesting, looking at charts, and developing software to carry out my trading plan. When you take trading seriously and instill a positive, improvement-focused attitude in yourself, once the market opens you should be executing a plan that you’re totally prepared for. You should essentially be following a script.
My Trading Script
I trade several strategies every day. My main set of strategies, though, follows this routine:
- Market opens, make sure my scanner is running.
- Watch my scanner and use discretion to finalize my watchlist of what’s tradeable.
- Look for pre-determined setups in stocks in my curated watchlist.
- Execute trades according to the strategy’s plan.
- Watch my trades like a hawk, obsessing over each and every tick.
Ha! I’m joking about #5 — once my trades are in I literally don’t watch them for the rest of the day — no kidding.
The vast majority of market days this works well. But what happens when every stock in the market looks “tradeable?”
On Big Market Days, Everything is Moving
On < 5% of market days, most every stock looks unusual!
These are the hardest types of days to deal with — there’s a lot of opportunity but you can’t realistically take every trade that looks unusual. It’s easy to get overwhelmed and become paralyzed on days like this. The problem is there is a lot of money to be made on these days so it’s good to prepare for them ahead of time. Here’s what I do.
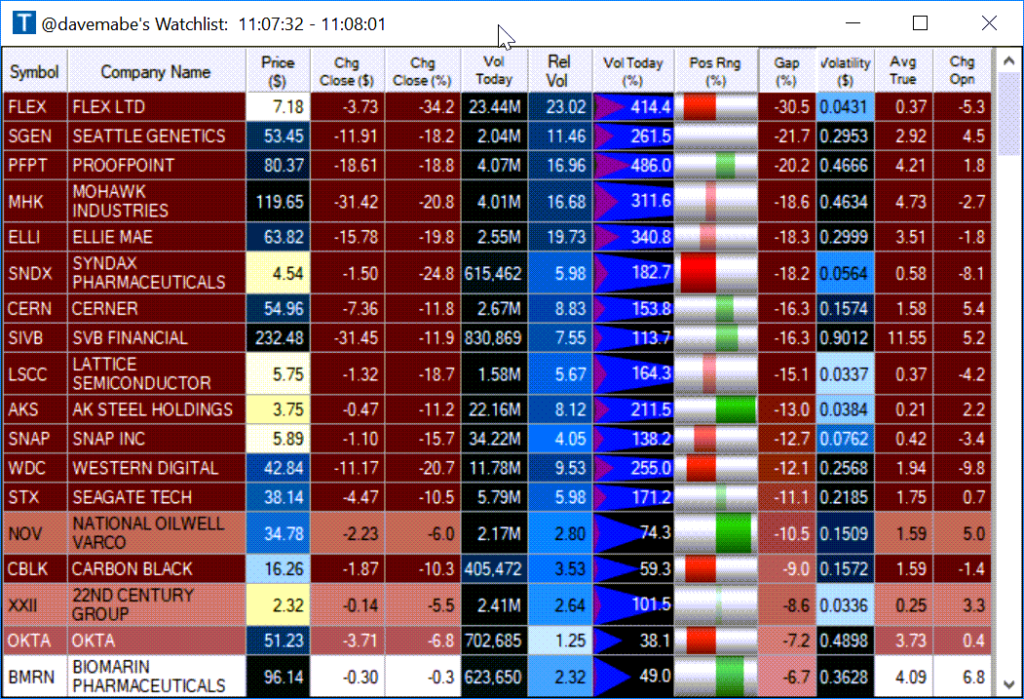
Today there were 64 stocks on my top list for this strategy when there’s normally ~10–15. The first thing I do is look at this top list that looks at a single stock: SPY. (Here’s the cloud link.)

I see that the SPY which represents the S&P 500 is trading at 13.8 relative volume. If SPY was trading “normally” it would have a relative volume of 1.0, so this means the SPY is doing 13.8 times it’s normal volume at this time of day — that’s a lot! Here’s what my unfiltered watch list looked like at the time (notice the vertical scroll bar!)

This top list also includes the relative volume column. If stocks have unusual activity but on lower relative volume than the overall market, then they’re not really that unusual even it a stock is doing 4 times its normal volume.
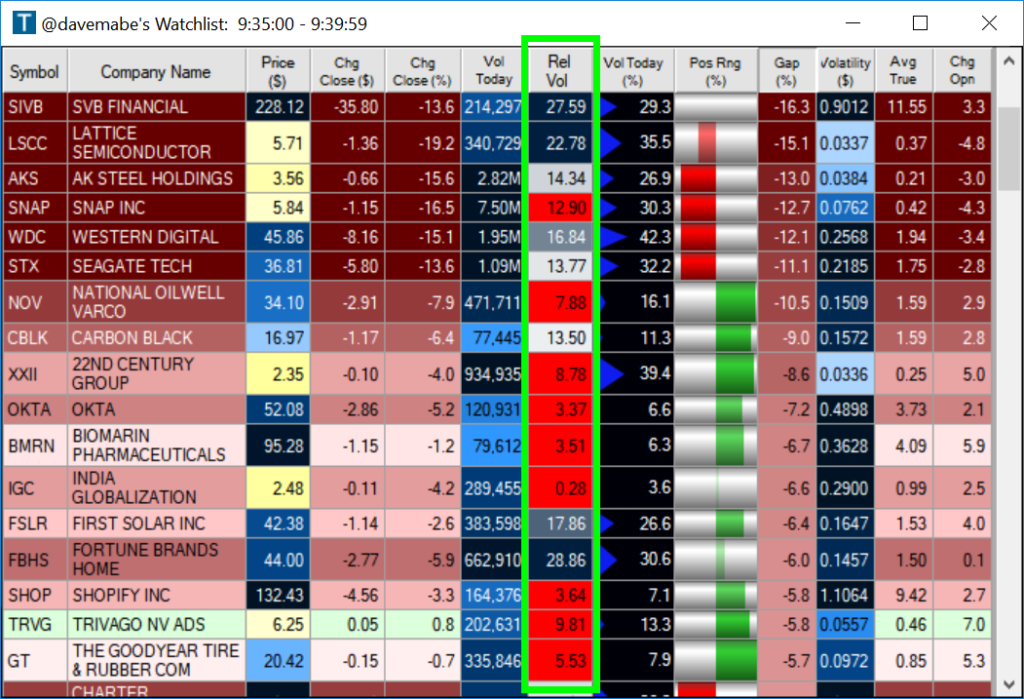
Here’s what the top list looks like after I’ve applied some custom coloring to the Relative Volume column:

The column comes alive showing you what is really unusual today compared to the overall market. Solid red shows me that it’s well below the threshold I’ve set. Darker blue tells me that the relative volume is unusual even on this market day. Lighter blue to white means it’s above the threshold but not by a ton.
This let’s me quickly see what is REALLY unusual given what the overall market is doing. I can very quickly and confidently narrow my list using data that I can rely on.
Try Trade-Ideas Now to Take Your Trading to the Next Level
If you liked this post, follow me on Twitter @davemabe to see my daily watchlist and links to future posts.
1 comment